Creating New Packages
Adding Graph Bricks
We highly recommend reading the previous section, Adding Function Bricks, which covers the general aspects of creating a Brick. In this section, we will focus on the special case of graph Bricks.
Graph Bricks are visual nodes that enable the display of Vega-Lite graphs, leveraging the capabilities of Vega-Lite to allow users to create a diverse range of graphs for various purposes and objectives. We assume you are familiar with the standards and properties of Vega-Lite.
Creating Your First Graph Brick
Creating a graph Brick is identical to creating a function Brick, as described in the previous section, except for two key differences:
The use of
coded_flows_metadatais mandatory, specifically through theframe_typeandvl_schemaparameters.key Description frame_typeSpecifies the dimensions for a
graphtype Brick. It can be one of the predefined values (landscape,portraitorsquare) or a custom value in the format of WidthxHeight in pixels, such as400x500or500x500(minimum value at 400 pixels).vl_schemaSpecifies the Vega-Lite schema for a
graphtype Brick.The Python function in the Brick file is a placeholder, used solely to define the structure and appearance of the Brick without performing any processing.
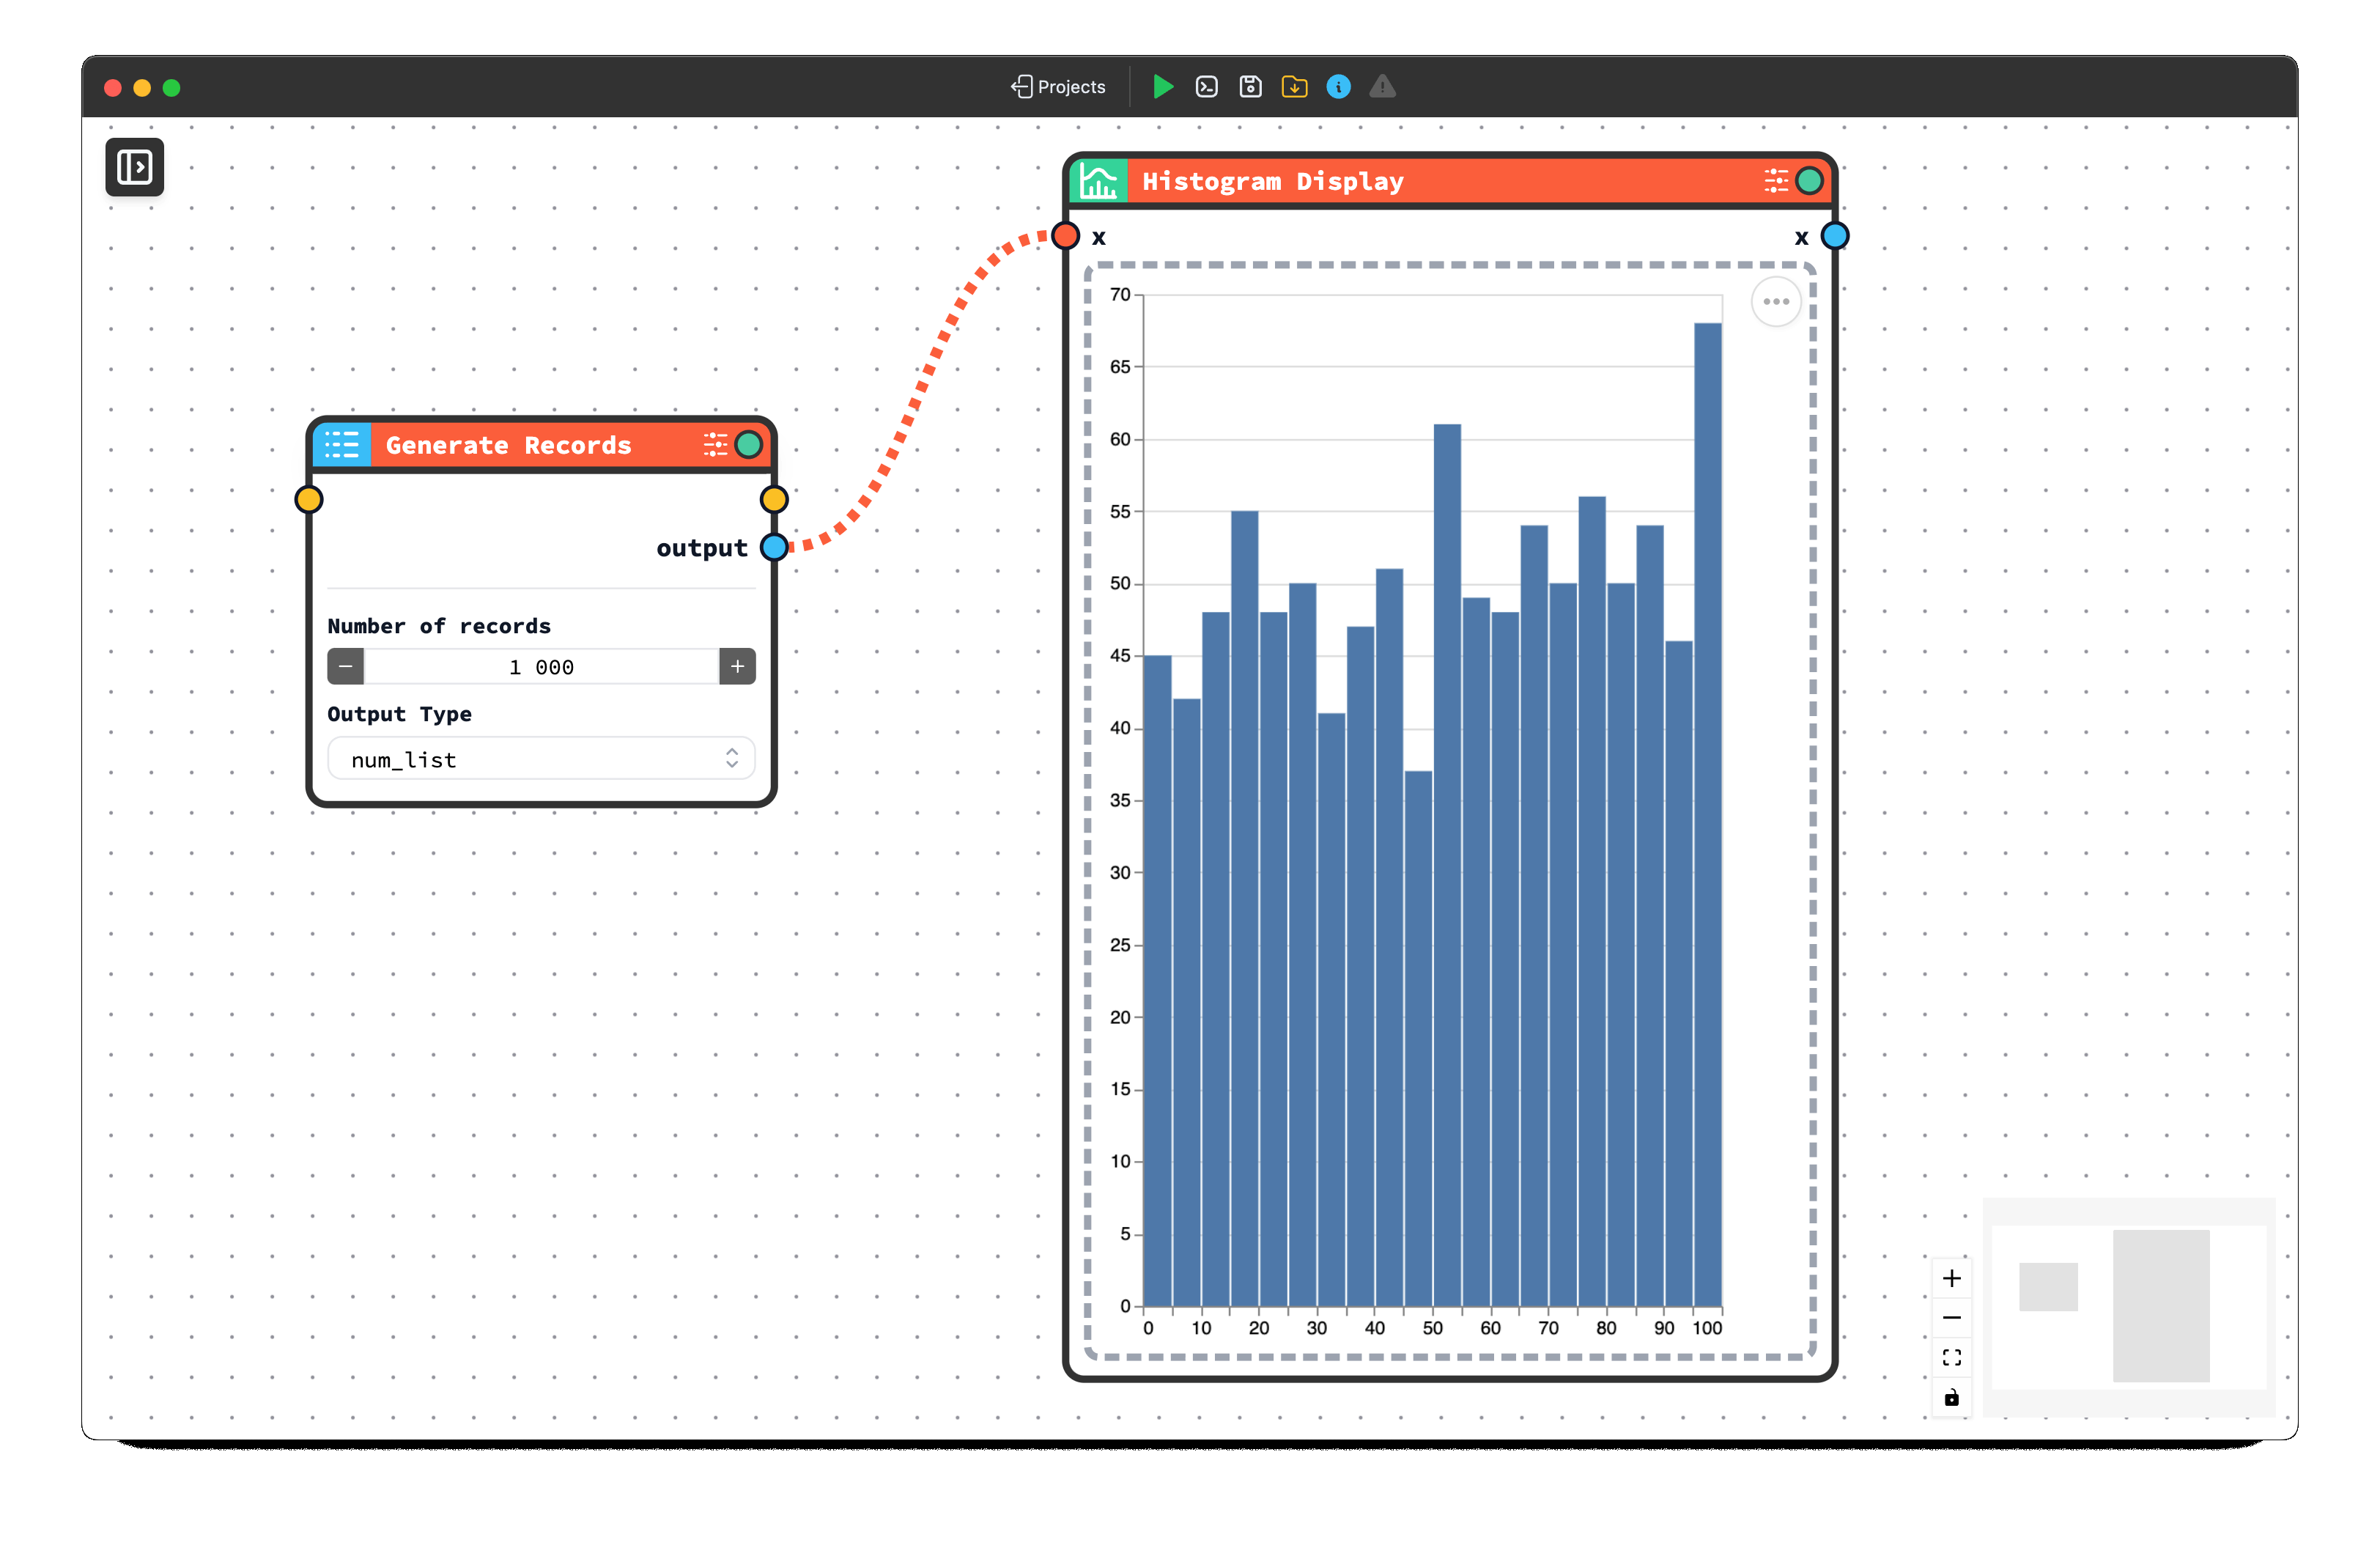
The following is an example of a graph Brick that represents a histogram:
from typing import Union
from coded_flows.types import List, DataSeries, NDArray, DataRecords, DataFrame


coded_flows_metadata = {
    "display_name": "Histogram",
    "description": "Histogram showing numeric data distribution as binned frequency counts.",
    "type": "graph",
    "icon": "chart-histogram",
    "options": [
        {
            "name": "values__bind",
            "display_name": "Values field",
            "type": "input",
            "default": "values",
        },
        {
            "name": "encoding__x__bin__maxbins",
            "display_name": "Values max bins",
            "type": "integer",
            "step": 5,
            "max": 300,
            "min": 5,
            "default": 40,
        },
    ],
    "frame_type": "500x500",
    "vl_schema": {
        "mark": "bar",
        "encoding": {
            "x": {
                "bin": {"maxbins": 40},
                "field": "values",
                "type": "quantitative",
                "title": "",
            },
            "y": {
                "aggregate": "count",
                "title": "",
                "type": "quantitative",
            },
        },
    },
}


def histogram(
    values: Union[List, DataSeries, NDArray, DataRecords, DataFrame],
    options,
) -> Union[List, DataSeries, NDArray, DataRecords, DataFrame]:
    return values
The core graph definition is contained in the vl_schema, which follows a standard Vega-Lite schema. You do not need to specify data, as CODED FLOWS will automatically apply it during display.
{
  "mark": "bar",
  "encoding": {
    "x": {
      "bin": { "maxbins": 40 },
      "field": "values",
      "type": "quantitative",
      "title": ""
    },
    "y": {
      "aggregate": "count",
      "title": "",
      "type": "quantitative"
    }
  }
}
For the graph framing, we have chosen a custom dimension of 500x500 pixels, specified as "frame_type": "500x500".
Understanding Input Naming and Data Binding
The Brick's placeholder function defines the inputs that will be passed to the graph. You can name these inputs anything you like—they are not restricted to Vega-Lite encoding names. In our example, we use values as the input name, which corresponds to the field reference in the Vega-Lite schema.
def histogram(values):
    return values
How Data is Passed to Vega-Lite
Graph Bricks expect inputs as fields in the data that will be automatically passed to the Vega-Lite schema:
For List, DataSeries, and NDArray types: The data uses the input parameter name as the field reference inside the Vega-Lite schema. The field is automatically added with the proper naming corresponding to the inputs of the brick.
For DataFrame and DataRecords types: If a column or key with the same name as the input parameter is present, it will be used directly. If not, you can use the
<input_name>__bindoption to specify which column or key to use from the input data.
Binding Options for DataRecords and DataFrame
When working with DataRecords or DataFrame inputs, you may need to map your input parameter to a specific column or key that has a different name. Use the <input_name>__bind option for this purpose.
The binding option name follows a simple pattern: <input_name>__bind, where <input_name> is the exact name of your input parameter. For example:
- If your input parameter is named
values, the binding option isvalues__bind - If your input parameter is named
groups, the binding option isgroups__bind - If your input parameter is named
temperature, the binding option istemperature__bind
Here's an example for the values input:
{
    "name": "values__bind",  # Corresponds to the 'values' input parameter
    "display_name": "Values field",
    "type": "input",
    "default": "values",
}
This allows users to specify that the values input should map to a particular field in their DataFrame or DataRecords (e.g., "distance", "temperature", etc.).
Multiple Inputs Example
For graphs with multiple data inputs, simply define multiple parameters:
def stacked_density(values, groups):
    return values, groups
Each input must be returned as an output as well.
Graph Bricks also require type hinting, which is always a Union of List, DataSeries, NDArray, DataRecords, or DataFrame.
# Single input
def histogram(
    values: Union[List, DataSeries, NDArray, DataRecords, DataFrame],
    options,
) -> Union[List, DataSeries, NDArray, DataRecords, DataFrame]:
    return values


# Multiple inputs
def stacked_density(
    values: Union[List, DataSeries, NDArray, DataRecords, DataFrame],
    groups: Union[List, DataSeries, NDArray, DataRecords, DataFrame],
    options,
) -> Tuple[
    Union[List, DataSeries, NDArray, DataRecords, DataFrame],
    Union[List, DataSeries, NDArray, DataRecords, DataFrame],
]:
    return values, groups
Interactivity of a Graph Brick
In our example, we used the Vega-Lite schema below, which has some fixed parameters: it uses a fixed number of bins (maxbins: 40) and expects a field named values.
{
  "mark": "bar",
  "encoding": {
    "x": {
      "bin": { "maxbins": 40 },
      "field": "values",
      "type": "quantitative",
      "title": ""
    },
    "y": {
      "aggregate": "count",
      "title": "",
      "type": "quantitative"
    }
  }
}
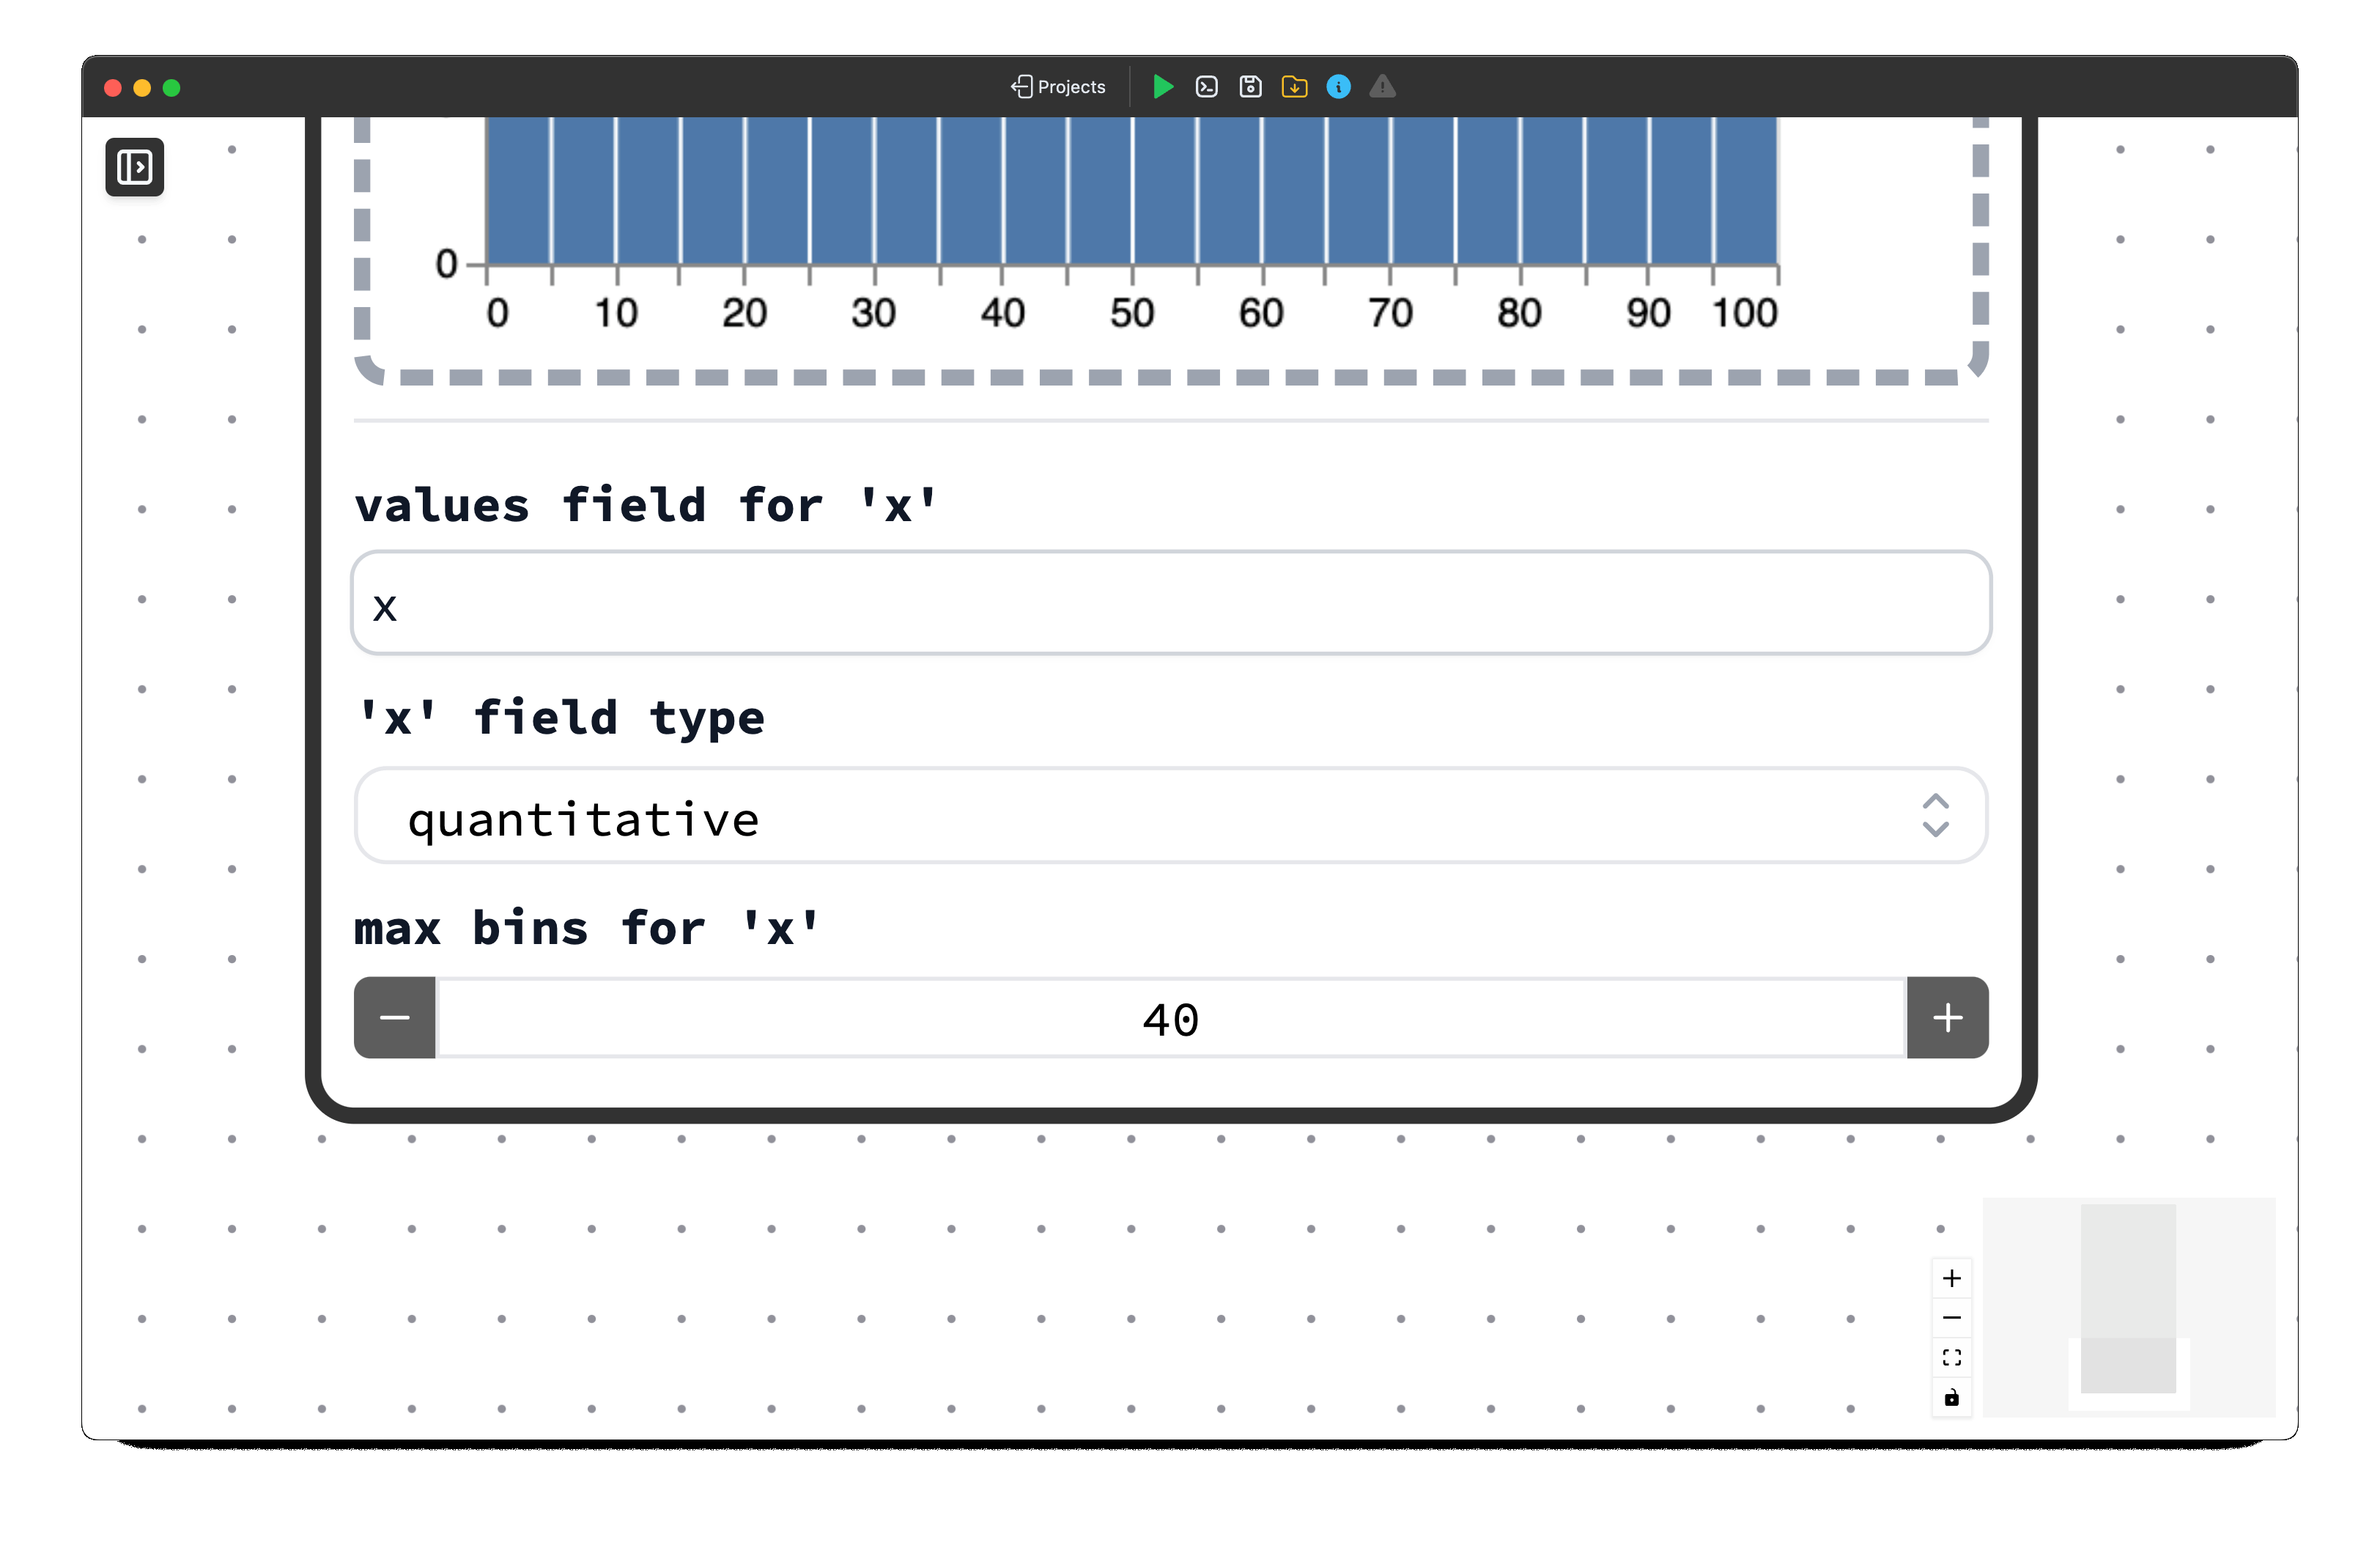
This setup is a good candidate for adding interactivity through options, allowing the user to dynamically change the field name or the number of bins.
The options parameter follows the same structure as previously seen in the Bricks function, but with a specific naming convention for each option.
Referencing Vega-Lite Schema Parameters
To make parameters in the Vega-Lite schema dynamic, we need to reference them using a path-like naming structure. For example, to make maximum bins dynamic, we reference the maxbins parameter, which is nested within multiple levels of the configuration hierarchy.
Since maxbins is located under the bin dictionary key, which is under the x encoding key, which is in turn under the encoding key, we must use: encoding__x__bin__maxbins, where each key in the hierarchy is separated by double underscores (__).
Binding Input Fields
For DataRecords and DataFrame inputs, use the <input_name>__bind pattern to allow users to specify which field in their data should be used:
{
    "name": "values__bind",
    "display_name": "Values field",
    "type": "input",
    "default": "values",
}
This is particularly useful when the user's data has columns with different names (e.g., "distance", "price", "temperature") that they want to visualize using your graph brick.
After including these options parameters (and don't forget to add options as an input to the main function), our Brick will now be enhanced with an interactive menu allowing users to customize the graph.
Advanced Example: Stacked Density Plot
When working with array elements within the configuration, the naming convention extends to include array indices. Here's a more complex example that demonstrates multiple input bindings and array parameter access:
from typing import Union
from coded_flows.types import List, DataSeries, NDArray, DataRecords, DataFrame, Tuple


coded_flows_metadata = {
    "display_name": "Stacked Density",
    "description": "Stacked density plot combines smooth curves for multiple groups, revealing overlaps and distribution trends.",
    "type": "graph",
    "icon": "chart-sankey",
    "frame_type": "landscape",
    "options": [
        {
            "name": "values__bind",
            "display_name": "Values field",
            "type": "input",
            "default": "values",
        },
        {
            "name": "groups__bind",
            "display_name": "Groups field",
            "type": "input",
            "default": "groups",
        },
        {
            "name": "transform__0__counts",
            "display_name": "Smoothed counts",
            "type": "toggle",
            "default": False,
        },
    ],
    "vl_schema": {
        "mark": "area",
        "transform": [
            {
                "density": "values",
                "groupby": ["groups"],
                "counts": False,
                "as": ["values", "density"],
            }
        ],
        "encoding": {
            "x": {"field": "values", "type": "quantitative", "title": ""},
            "y": {
                "field": "density",
                "type": "quantitative",
                "stack": "zero",
                "title": "",
            },
            "color": {"field": "groups", "type": "nominal"},
        },
    },
}


def stacked_density(
    values: Union[List, DataSeries, NDArray, DataRecords, DataFrame],
    groups: Union[List, DataSeries, NDArray, DataRecords, DataFrame],
    options,
) -> Tuple[
    Union[List, DataSeries, NDArray, DataRecords, DataFrame],
    Union[List, DataSeries, NDArray, DataRecords, DataFrame],
]:
    return values, groups
In this example, the counts parameter is nested within the first transform operation (index 0) of the transform array. To make this parameter interactive, we use transform__0__counts, where transform is the top-level key, 0 represents the array index, and counts is the specific parameter we want to control. This pattern applies universally: for any parameter nested within arrays, simply insert the corresponding index between the parent key and the target parameter, all separated by double underscores.